The user friendly Management Portal is a cloud-based (SaaS) platform that provides users with a powerful and easy to use dashboard to monitor measure and understand electrical energy consumption from the multi-site level to an individual device level. The solution goes beyond kilowatts to give organisations actionable business intelligence insights about their individual electric devices to manage assets more efficiently and cost-effectively. Users can identify savings opportunities, detect equipment malfunction and reduce unwanted energy waste.
Features & Benefits
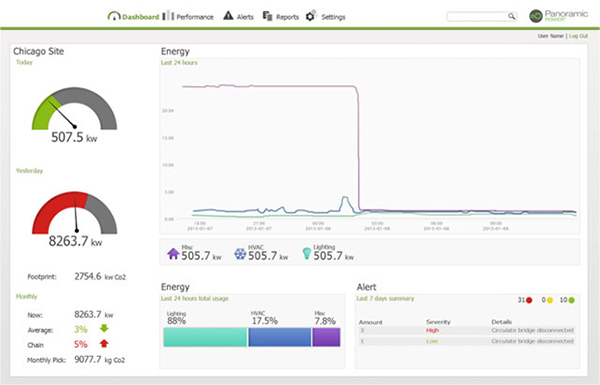
- Dashboards: Provides user with several options to view energy consumption from an individual device to a facility’s holistic energy consumption. Easy access to real time information. Dashboards can provide data, from a single site to multiple sites. Dashboard views include: consumption patterns, daily energy usage, carbon footprint indicator, energy distribution by load type, alerts, monthly forecast, navigation map, and multi-location benchmarks
- Online Analytics: Supporting graphs and analytic capabilities available at the click of a mouse (i.e. comparison over time of a single load, comparing between different loads and heat maps). Easy access to both real time and historical data
- Rules & Alerts: Various types of real time alerts distributed via email or text, to indicate specific anomalies in energy consumption. Alerts include: off schedule consumption, failure detection, excess consumption, too low consumption, circuit overload and more.
- Scheduled automatic reports: Report templates or customized reports that are periodically generated and sent to stakeholders or saved for future use. The reports summarize consumption, insights and compare consumption by site, load and/or using calculated benchmarks
- Easy integration with 3rd party Software: A simplified API can be used by partners to export real time and historical data from the cloud into other 3rd part software applications.
 Up to the minute electricity prices and demand from SEMO